In this blog post we will cover how to generate more leads after your livestream.

There are 2 strategic approaches you can do. One is reposting your livestream videos to increase engagement and generate leads.
Two is with Facebook Live Analytics where you can analyze your statistics on your followers and insights to further improve your marketing plan and strategies.

To generate more leads, first you need to attract visitors to tune into your Facebook livestream and to do that you need a compelling thumbnail together with a good description. It’s important because images communicate quicker than words especially when your audience are scrolling through their Facebook newsfeed.
To do this, click on the date of the post in the timeline to open it and then click on “edit.”
You will be directed to the “Edit Video” page.
In this section, you will have the option to utilize the Basic captions and Advanced tabs. Basic Captions allows you to choose a category that suits your video which makes your video easier to show up in the search feed.
You can come up with your own title and upload a thumbnail as well. Similar to Youtube, Facebook will automatically generate default thumbnails based on the content of your video. Compared to using default thumbnail generated by Facebook, it is advised to design your own thumbnail because you would have more control over its appearance and it can also be branded.
Once your recorded livestream footage has been posted, keep track of the engagements such as likes, shares and comments.
Gaining leads in your livestream is important to gain more insights on your audience interest or inquiry into your products or services of your business. Through Facebook Insight, you can now assess the performance of your livestream and that will help you improve in your future livestreams.

To analyze your video stats, go to your Facebook page and click on Insights at the top.
Scroll to the left side towards the navigation section and select Videos.
On the right-hand side, you can see your video views in the chart and if you want to alter the date range, just key in the dates in the “Start” and “End” boxes. You have the option to filter your stats in “Organic VS Paid”, “Auto-Played VS Click-to-Play” or “Unique VS Repeat”.

In Figure 2, the video view in the news feed lasts for 3 seconds even if the video is auto-played or clicked-to-play. For additional details, you can hover and then click anywhere on the chart.
Overview metrics can assist you in determining the right days that are good for livestreaming as well as to compare the right type of approach that leads to a video view. It’s important because you would want your audience to watch your video from the start, right to the end.

To access your Facebook Live Analytics, head over to your Facebook page and access your video page located on the left side. Next, click on video library to access your live videos.

Next, referring to Figure 4, access your video statistics by clicking on the video title.
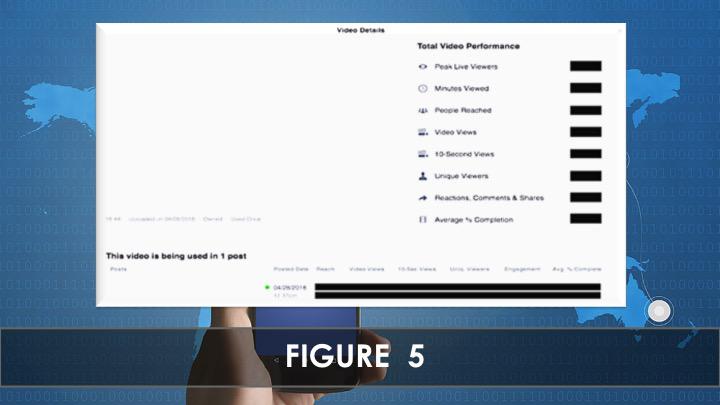
In this particular video detail, the performance analytics for Facebook Live videos are entirely the same for normal videos on Facebook Analytics.
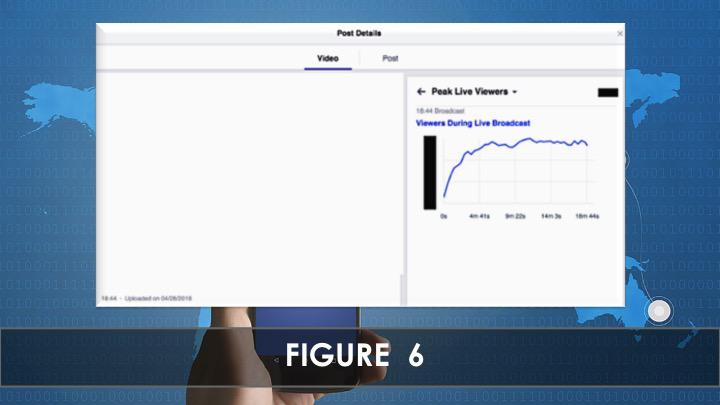
Besides insights on your statistics, you can access each metric in detail to analyze how the statistics changed over time when you are livestreaming.
Take for instance if you click into “Peak Live Viewers,” the interactive graph will tell you at which point in your livestream you got the highest live viewers.
To nail down which part of your Facebook Live videos works, you need to find your live video statistics, understand it and boost up your live video metrics.
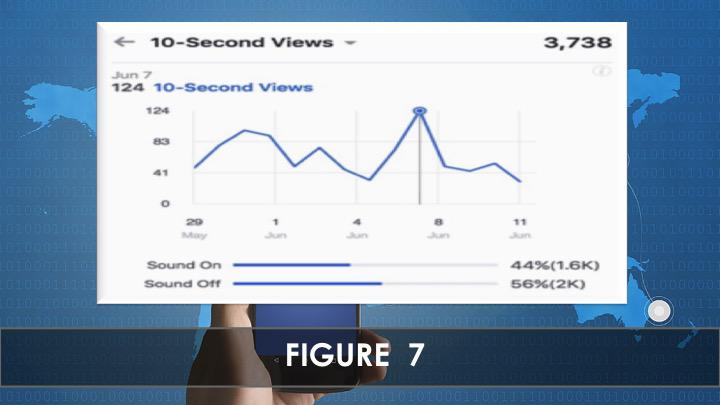
Facebook Live Analytics provides more detailed metrics compared to normal videos in 2 formats. In 10-second views, you can find out how many viewers have watched 10 seconds or more of your livestream.
The stats will even indicate the percentage of how many visitors have watched with the audio on and off.

In Figure 8, a high completion rate is a good sign that your livestream is good as long as the percentage is above 25%.
Based on the data obtained from this metric, you can determine which livestream content has the most consistent viewership and you know at which point your viewership drops off.
This is a great way to estimate and plan the duration of your future livestreams.

In the Post Views tab, you can check out see many visitors you have to reach out during your livestream, total views and the engagements that occurred throughout the livestream in the form of reactions, comments, and shares.
You can also check out your view Post Clicks, divided by “Clicks to Play” and “Link Clicks”.
Any negative feedbacks in the form of hide post or unlike page can be seen in this section.
The negative feedback does not entirely affect your overall quality of your livestream as long as the percentage is 1% or less of the total reach.
In the Video Views tab, you can access the metrics data gathered to determine which type of content received the best reactions and engagement.
With these results, you can optimize your overall quality of your future livestream.
In summary, with Facebook Live analytics, you can understand how your followers are responding to your live stream to help you develop better content.
Watch Video
In the next blog post we will discuss How To Target And Retarget Your Facebook Audience
Til next time.
Moni Arora
 Moni Arora’s Blog
Facebook
Linkedin
Twitter
Email Me
P.S. If you found value in this blog post please LIKE, COMMENT and SHARE with someone who can benefit from this.

